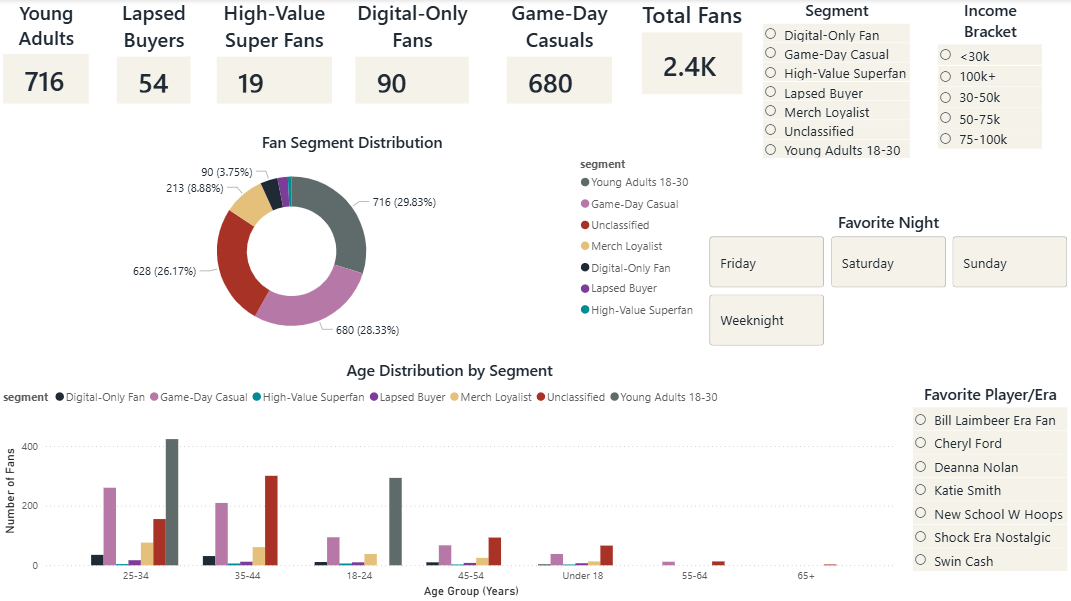
Detroit Shock Fan Segmentation & Revenue Analytics
Built a multi-page Power BI dashboard using SQL-modeled fan data to deliver audience-level insights across revenue, engagement, and digital touchpoints—supporting executive, CRM, and revenue stakeholders with connected funnel-ready reporting.
Download PBIX View README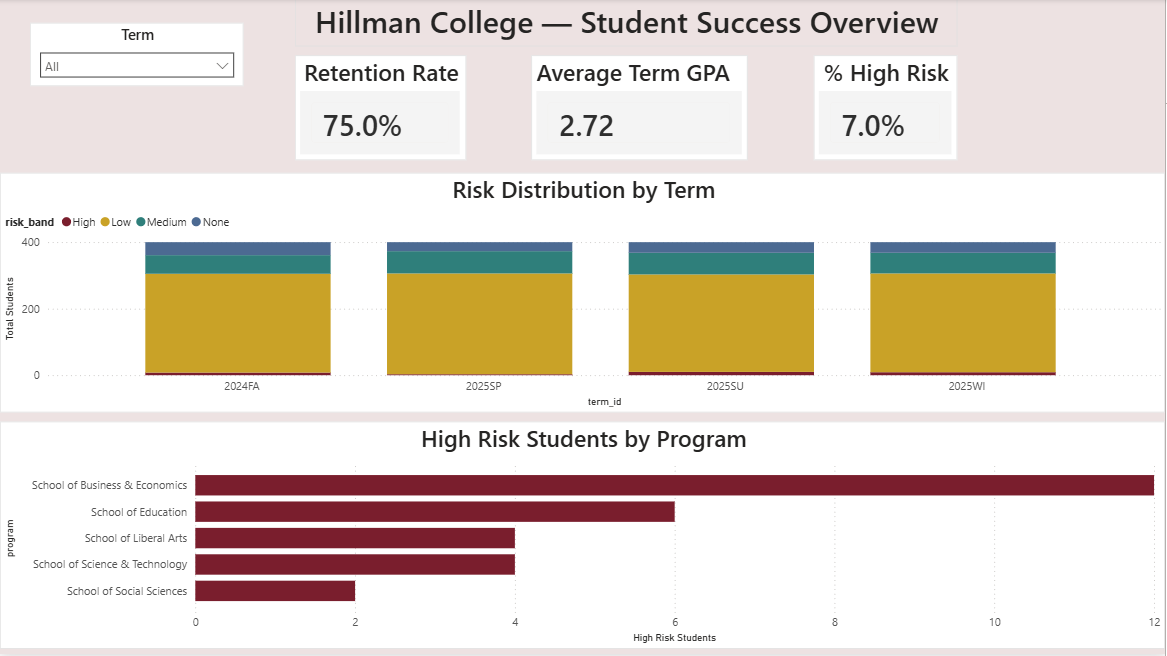
Hillman College Student Success & Early Alert Analytics
Designed a multi-page Power BI analytics platform using SQL and Python-generated student data to support early alert systems, retention analysis, and institutional research insights—enabling proactive advising and data-informed student success strategy.
Download PBIX View README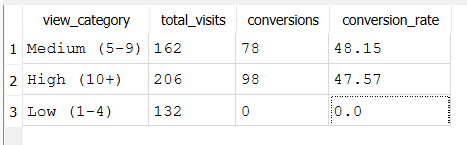
SQL Website Customer Insights
Created an SQLite database of synthetic website visitor data. Ran advanced SQL queries to uncover conversion rates, average time on site by device, and campaign performance with detailed tables.
View SQL File View Table
Customer Experience KPI Dashboard
Built a Power BI dashboard to track support metrics: resolution time, % resolved, customer ratings, with DAX measures and interactive visuals by channel and agent. Highlighted opportunities to improve chat resolution times.
Download PBIX View README